In wireless telecommunications, understanding signal quality metrics is paramount for network optimization, troubleshooting, and ensuring superior user experience.
Whether you’re a network engineer, RF optimization specialist, or simply curious about how your mobile device maintains connectivity, mastering the trio of RSRP, RSRQ, and SINR is essential. These three key performance indicators serve as the cornerstone for evaluating 4G LTE and 5G network performance, each revealing distinct aspects of your wireless connection.

The Foundation: What Makes These Metrics Critical?
Modern cellular networks operate in increasingly complex environments. Urban canyons, dense indoor spaces, high-speed mobility scenarios, and interference from neighboring cells create a challenging landscape for maintaining reliable connections. This is where RSRP, RSRQ, and SINR come into play. These measurements provide a comprehensive snapshot of radio frequency conditions, enabling both network equipment and user devices to make intelligent decisions about handovers, power control, modulation schemes, and resource allocation.
Unlike earlier generation networks that relied on simpler signal strength measurements, 4G LTE and 5G networks utilize these sophisticated metrics to support advanced features like carrier aggregation, massive MIMO, beamforming, and ultra-reliable low-latency communications.
Understanding these parameters isn’t just academic—it directly impacts download speeds, call quality, latency, and overall network efficiency.
Radio Frequency Experience – A Reference Table.
Here is a RF experience table that explains how will network perform in different senarios and your experience of download and upload with latency affects.
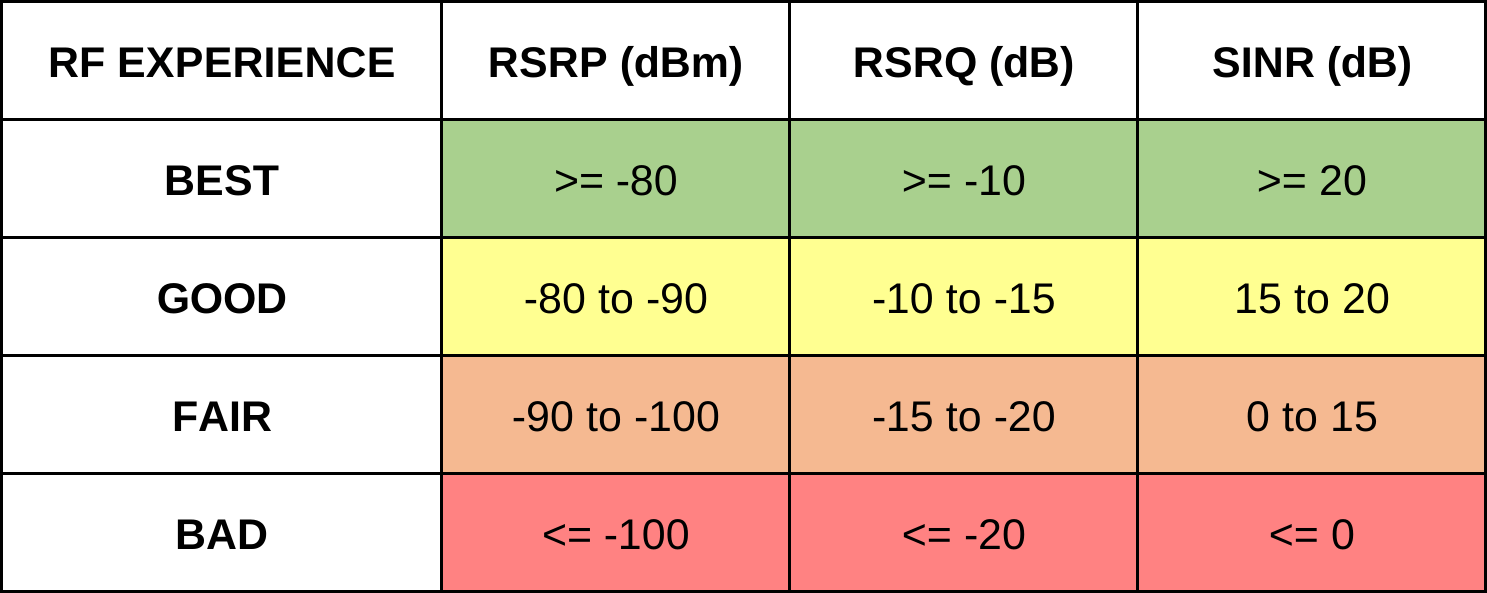
The reference table shows quality thresholds for all three metrics, color-coded from best to worst. Green represents excellent conditions where you’ll get max possible speeds and reliability, yellow indicates good performance suitable for most activities, orange means degraded service with noticeable slowdowns, and red signals poor connectivity with frequent issues.
Notice that all three metrics need to be good simultaneously—you could’ve excellent RSRP (strong signal) but terrible RSRQ and SINR (high interference), which still results in a poor experience as overall connection.
Aim to stay in the Green or Yellow zones for reliable service.
RSRP: Reference Signal Received Power.
The Core Concept.
Reference Signal Received Power, commonly abbreviated as RSRP, represents the average power received from a single reference signal resource element. Think of it as the fundamental measure of signal strength from a specific cell tower. In technical terms, RSRP is measured in dBm (decibels relative to one milliwatt) and indicates the power level of the LTE or 5G reference signals received by the user equipment.
How RSRP Works?
In LTE networks, reference signals are transmitted by the eNodeB (evolved Node B) at known positions within the resource grid. These reference signals are scattered throughout the frequency and time domain, allowing the UE (User Equipment) to measure the received power accurately. The device samples multiple reference signal resource elements and calculates the average power, filtering out noise and interference to obtain a clean RSRP value.
For 5G NR (New Radio) networks, the concept remains similar but uses SSB (Synchronization Signal Block) or CSI-RS (Channel State Information Reference Signals) for measurement. The 5G implementation offers more flexibility and precision, particularly in scenarios involving beamforming and massive MIMO configurations.
Interpreting RSRP Values.
According to the RF experience classification table, RSRP values equal to or greater than -80 dBm are considered “BEST,” indicating excellent signal strength. This level typically occurs when you’re close to a cell tower with minimal obstructions. Values between -80 and -90 dBm fall into the “GOOD” category, representing solid connectivity suitable for all services including high-definition video streaming and low-latency gaming.
When RSRP drops to the -90 to -100 dBm range, the experience is classified as “FAIR.” At this level, you’ll still maintain connectivity, but data speeds may decrease, and you might experience occasional buffering during streaming. Values at or below -100 dBm are considered “BAD,” where maintaining a stable connection becomes challenging, and you may experience frequent disconnections or inability to access data services.
Practical Implications.
RSRP serves as the primary metric for cell selection and reselection. When your device decides which cell tower to connect to, RSRP is the leading factor in that decision. However, RSRP alone doesn’t tell the complete story. A strong RSRP doesn’t automatically guarantee excellent performance if interference is high or the signal quality is poor—this is where RSRQ and SINR become crucial.
RSRQ: Reference Signal Received Quality.
Understanding Signal Quality.
While RSRP measures signal strength, Reference Signal Received Quality (RSRQ) evaluates the quality of that signal. Measured in dB (decibels), RSRQ is a ratio that considers both the signal strength and the interference level, including noise and interference from other cells. This makes RSRQ particularly valuable in dense network deployments where multiple cells operate on similar frequencies.
The Mathematics Behind RSRQ.
RSRQ is calculated using the formula: RSRQ = (N × RSRP) / RSSI.
Here N represents the number of resource blocks in the measurement bandwidth, and RSSI (Received Signal Strength Indicator) includes the total received power from all sources—the serving cell, neighbor cells, and noise.
Determining N:
N is simply the number of resource blocks over which the RSRQ measurement is performed, determined by the system bandwidth configuration.
In LTE, standard bandwidths translate directly to specific N values: 1.4 MHz → N=6, 3 MHz → N=15, 5 MHz → N=25, 10 MHz → N=50, 15 MHz → N=75, and 20 MHz → N=100 resource blocks. The value of N is known from the system information broadcast by the cell, specifically from the transmission bandwidth configuration parameter.
For instance, if a cell operates on 10 MHz bandwidth and RSRQ measurement uses the full bandwidth, then N=50. This multiplier in the RSRQ formula normalizes the measurement, ensuring that RSRQ remains comparable across different bandwidth configurations.
Measuring RSSI:
RSSI is measured by calculating the total wideband received power across all resource blocks within the measurement bandwidth. In practice, this means summing the power spectral density across all subcarriers in the allocated bandwidth.
For example, if measuring over 50 resource blocks (each containing 12 subcarriers with 15 kHz spacing), the RSSI would be the integral of received power across approximately 9 MHz of bandwidth (50 × 12 × 15 kHz = 9000 kHz). The measurement is performed by the UE’s receiver, which samples the received signal and computes: RSSI = ∑(Power per subcarrier) across all subcarriers in the measurement bandwidth.
This includes power from the serving cell’s reference signals, data channels, control channels, interference from neighboring cells, and thermal noise.
This calculation provides insight into how much of the total received energy comes from the desired signal versus interference and noise.
RSRQ Classification.
Looking at the RF experience table, RSRQ values of -10 dB or better are classified as “BEST,” indicating minimal interference and excellent signal quality. The “GOOD” range spans from -10 to -15 dB, where performance remains strong with only minor interference effects. When RSRQ falls between -15 and -20 dB, the experience is “FAIR,” suggesting moderate interference that may impact throughput and latency. Values at or below -20 dB are “BAD,” indicating severe interference or poor signal quality that significantly degrades performance.
When RSRQ Matters Most.
RSRQ becomes especially important in scenarios where you have adequate signal strength but poor performance. For instance, you might have an RSRP of -75 dBm (excellent) but an RSRQ of -18 dB (fair), indicating that while the signal from your serving cell is strong, there’s significant interference from neighboring cells or noise. This situation commonly occurs at cell edges or in densely populated areas with many overlapping cells.
Network engineers use RSRQ extensively for load balancing and interference management. By analyzing RSRQ patterns across the network, they can identify problematic areas, adjust antenna tilts, modify power levels, or implement frequency planning changes to improve overall quality.
SINR: Signal to Interference plus Noise Ratio.
The Ultimate Performance Indicator.
Signal to Interference plus Noise Ratio, or SINR, is arguably the most comprehensive metric for understanding real-world network performance. Measured in dB, SINR directly indicates the ratio between the desired signal power and the combined power of interference and noise. Unlike RSRP and RSRQ, SINR provides a direct correlation to achievable data rates and spectral efficiency.
SINR in Action.
SINR is calculated by comparing the received signal power from the serving cell against the total interference plus noise power. High SINR values indicate that the desired signal significantly exceeds interference and noise, enabling the use of higher-order modulation schemes like 256-QAM or even 1024-QAM in advanced 5G deployments. These sophisticated modulation schemes pack more bits per symbol, directly translating to higher throughput..
Conversely, low SINR forces the network to use more robust but less efficient modulation schemes like QPSK (Quadrature Phase Shift Keying), which offers better resistance to interference but carries fewer bits per symbol, resulting in lower data rates.
SINR Performance Thresholds.
According to the RF experience classification, SINR values of 20 dB or higher represent “BEST” conditions. At this level, users experience peak throughput, minimal latency, and can utilize the most advanced network features. The “GOOD” range spans from 15 to 20 dB, still providing excellent performance for virtually all applications.
When SINR drops to between 0 and 15 dB, the experience is “FAIR.” Performance remains adequate for basic services, but high-bandwidth applications may suffer. Users might notice reduced download speeds and increased latency. SINR values at or below 0 dB are classified as “BAD,” where maintaining any data connection becomes extremely difficult, and voice calls may drop or exhibit poor quality.
The Link Budget Connection.
SINR is fundamental to the link budget equation that determines maximum achievable data rates. Network planning engineers use SINR projections to predict coverage areas, capacity, and service quality. In 5G networks, SINR becomes even more critical due to the use of wider bandwidths, massive MIMO arrays, and beamforming technologies that can significantly influence the interference landscape.
The Interplay: How These Metrics Work Together.
While each metric provides valuable information independently, their true power emerges when analyzed collectively. Consider a scenario where you have excellent RSRP (-70 dBm), poor RSRQ (-18 dB), and mediocre SINR (8 dB). This profile suggests you’re receiving a strong signal from the serving cell, but significant interference from neighboring cells is degrading quality and limiting throughput.
Alternatively, moderate RSRP (-85 dBm), good RSRQ (-12 dB), and good SINR (17 dB) indicates a balanced scenario where signal strength is adequate, interference is well-managed, and performance should be reliable. This often represents optimal network tuning.
4G LTE vs. 5G Implementation Differences.
While the fundamental concepts of RSRP, RSRQ, and SINR remain consistent between 4G LTE and 5G NR, implementation details differ significantly.
5G introduces SS-RSRP, SS-RSRQ, and SS-SINR based on Synchronization Signal blocks, alongside CSI-RSRP, CSI-RSRQ, and CSI-SINR based on Channel State Information Reference Signals.
5G’s beamforming capabilities add another dimension to these measurements. Unlike LTE’s omnidirectional or sector-based transmission, 5G can create narrow, focused beams that dramatically improve SINR for specific users.
This means 5G RSRP and SINR values can exhibit more variability and higher peak values than LTE counterparts.
Additionally, 5G networks operating in mmWave frequencies (which are 24-100 GHz) demonstrate different propagation characteristics compared to sub-6 GHz LTE networks. Still, the metrics remain the same, but typical values and their implications shift due to higher path loss and different interference patterns.
Practical Optimization Strategies.
For network engineers, improving these metrics involves multiple strategies. RSRP enhancement typically requires increasing transmit power, adding new cell sites, or improving antenna systems. RSRQ improvement focuses on interference mitigation through careful frequency planning, inter-cell interference coordination (ICIC), and advanced features like enhanced ICIC (eICIC) for heterogeneous networks.
SINR optimization combines both approaches while also addressing noise factors through equipment upgrades, proper grounding, and shielding. In 5G networks, advanced beamforming and beam management techniques offer powerful tools for simultaneously improving all three metrics for individual users.
Measurement and Monitoring.
Modern smartphones and specialized RF testing equipment continuously measure these parameters. Network operators use drive testing, stationary testing, and crowdsourced analytics to build comprehensive coverage and quality maps. These measurements inform network investment decisions, optimization priorities, and troubleshooting efforts.
For end users, various mobile applications can display real-time RSRP, RSRQ, and SINR values, providing insight into connection quality. Understanding these values helps explain why performance varies across locations and times, and can guide decisions about placement of fixed wireless access equipment or mobile hotspots.
Conclusion: The Path to Network Excellence
RSRP, RSRQ, and SINR form the essential triangle of wireless network performance measurement. RSRP tells you about signal strength, RSRQ reveals signal quality amidst interference, and SINR directly indicates achievable performance. Together, they provide network operators and users with comprehensive insight into radio frequency conditions.
As 5G networks continue evolving with advanced features like network slicing, edge computing, and ultra-reliable low-latency communications, these fundamental metrics remain central to ensuring quality of service. Whether you’re troubleshooting poor connectivity, planning network expansion, or simply understanding your mobile experience, mastering RSRP, RSRQ, and SINR is invaluable.
The RF experience classification table provides clear benchmarks for interpreting these metrics, but remember that real-world network performance depends on the intricate interplay of all three parameters, along with other factors like backhaul capacity, network congestion, and device capabilities. By understanding and monitoring these key indicators, we can work toward the ultimate goal of seamless, high-performance wireless connectivity everywhere.
Leave a Reply